[From Deep-Sea Life 11, available here]
During the initial planning phase of the Deep Ocean Observing Strategy (DOOS) Project, an online, community-wide inventory tool was developed to assess the current state of deep-ocean observations. The inventory questionnaire is designed to solicit information concerning programmatic and academic research, standard operating procedures for data collection and sensor-specific variables, data archiving and dissemination, and expansion and collaboration opportunities. The inventory specifically seeks to assess the status of deep-ocean observing with respect to geographic coverage, water depths, platforms, sensors, variables measured, and temporal and spatial coverage. It informs development of DOOS priorities and helps identify potential partners, and to reach agreement on a common statement of requirements, leading to an initial strategy for sustained global deep-ocean observations. The inventory considers all Essential Ocean Variables (EOVs), regions, technologies, and societal imperatives in order to extract high priority, feasibility, and GOOS fit-for-purpose actions for the next 5-10 years; as well as identifies gaps in geographic coverage, water depth, and EOVs.

In preparation for the DOOS Community Workshop, an initial analysis was conducted using data from responses through November 2016. Seventy responses from 39 organizations, representing 83 countries, and funded by 29 agencies were examined. The overarching goal of the analysis was to identify gaps in geographic coverage, water depth, and EOVs. Of the responses, most program-wide sampling occurred across large depth ranges (200- 6000 m) and spatial scales (>1,000 km). The most common platforms used for observations were research ship surveys, bottle samplers, and moorings; the most common instruments were CTD’s, oxygen sensors, and ADCPs. The most common mature EOVs sampled were temperature, salinity, dissolved oxygen, and carbonate system; additional variables commonly suggested by respondents as key to include in DOOS were primary productivity, water velocity, inorganic nutrients, and species abundance and diversity; many of these already exist as EOVs in some form.
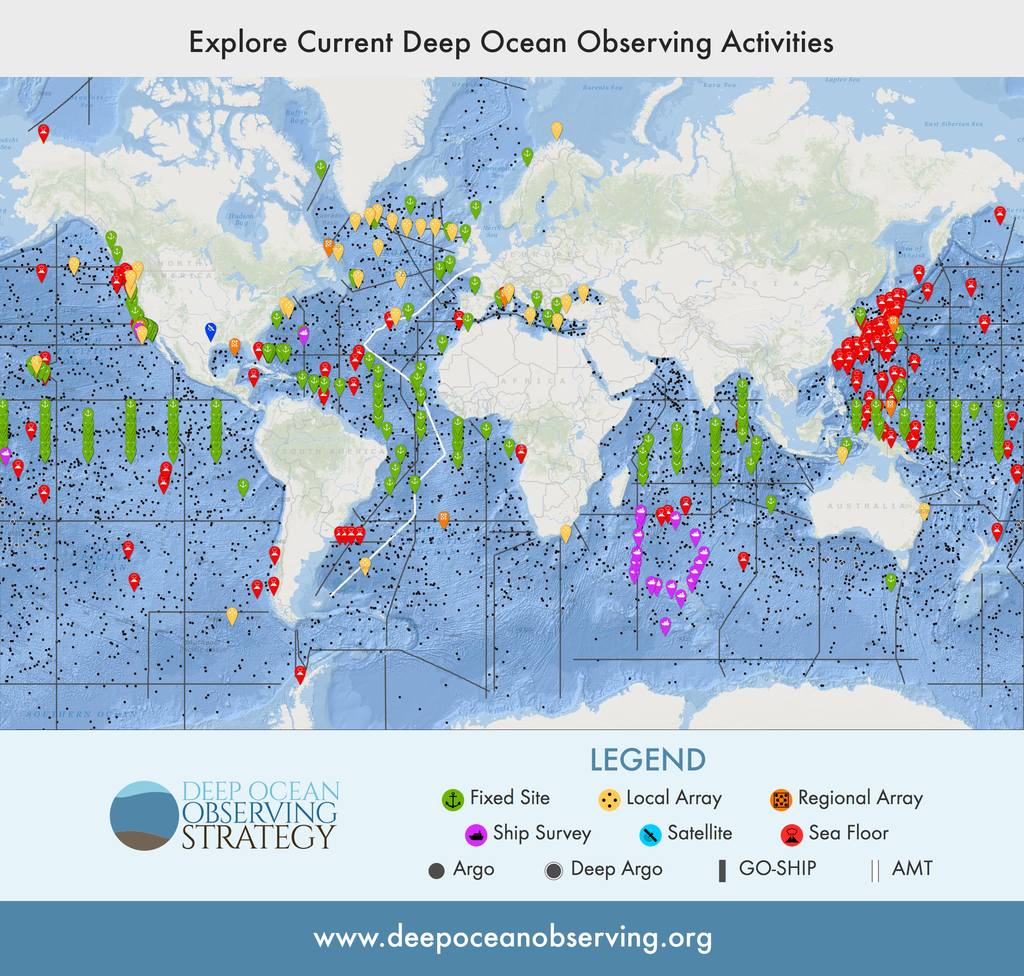
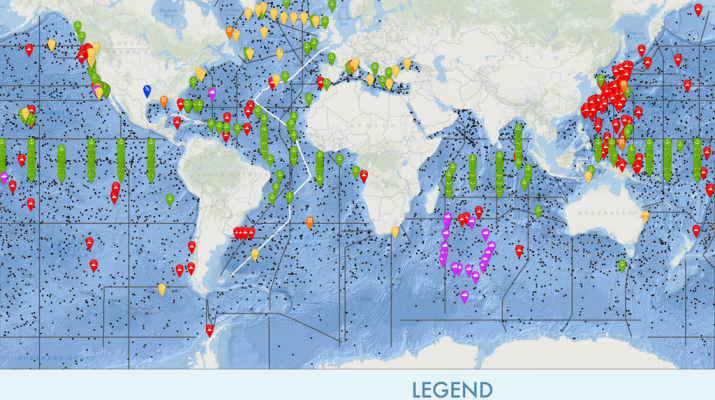
Based on inventory results, an interactive map located on the DOOS website provides a snapshot of observation efforts being conducted across the globe and at different depths. Visualization of the data was produced via ESRI. The map is updated quarterly, as data are modified.
The interactive map and link to the inventory can be found here.
The interactive map shows spatial gaps in observations and opportunities for expansion. The data obtained through the inventory feeds into the overall DOOS mission to bring together the broad range of expertise required to identify the challenges and seek solutions that will advance our understanding of- and maintain the functioning and services of the deep ocean. Gap analysis is an ongoing objective of DOOS.

