[From Deep-Sea Life 11, available here]
Amanda N. Netburn (1), Elan Portner (2), Bruce Robison (3), Barbara Block (2) (Chief Scientist)
(1) NOAA Ocean Exploration and Research, (2) Stanford University, (3) Monterey Bay Aquarium Research Institute
The R/V Falkor made port in San Diego on May 19 after a month-long expedition to explore the White Shark Café (WSC), a region the size of New Mexico roughly halfway between Hawaii and the Baja peninsula. Biologging devices have demonstrated that white sharks migrate from coastal California and Mexico to the subtropical gyre where they spend up to six months of the year. Males and females both come to this region and display diverse diving behaviors. Females have a diel pattern and males do rapid oscillatory diving from the surface to over 500 m many times an hour. Far from land, there has been little investigation of the WSC, and on April 20 a multidisciplinary team aboard the R/V Falkor set out to understand why the white sharks migrate to this apparent oceanic desert. In the fall prior to the expedition, a record number of white sharks had been tagged with pop-up satellite archival tags (PAT), programmed to pop up during the expedition. Nearly all the PAT tagged sharks transited into the WSC, leading the science team to this intriguing pelagic hotspot. To date, no one knows why the white sharks come to the Café. One hypothesis to explain this behavior is that it is related to reproduction. A second compelling hypothesis is that the sharks are feeding on organisms associated with the deep scattering layer, occurring at the mesopelagic (>200 m) depths to which the sharks repeatedly dive. In order to learn more about the oceanography in the WSC, we conducted a comparative series of oceanographic observations that spanned from video surveys, net tows, hydrography, acoustics, and molecular ecology.
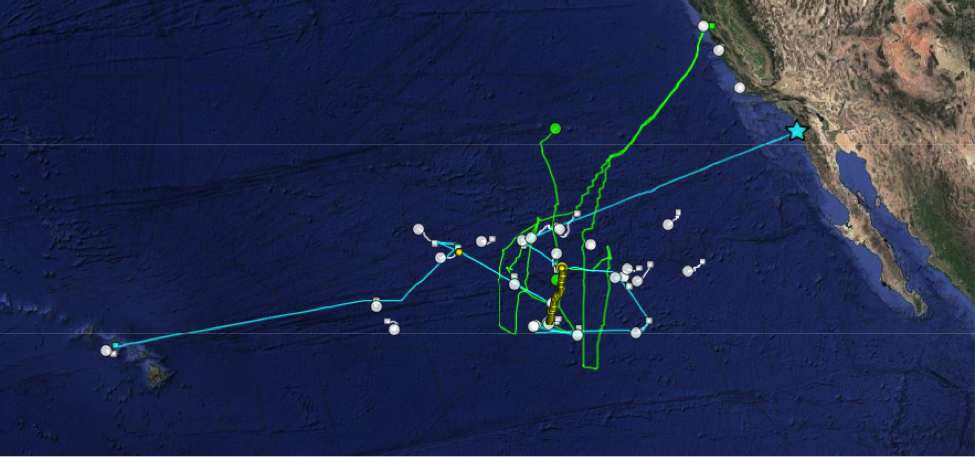
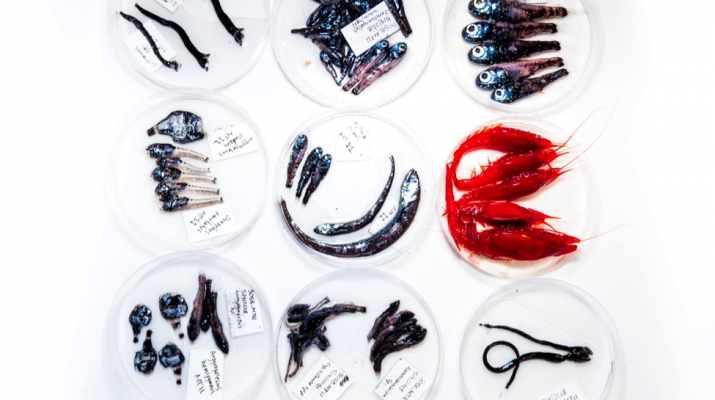
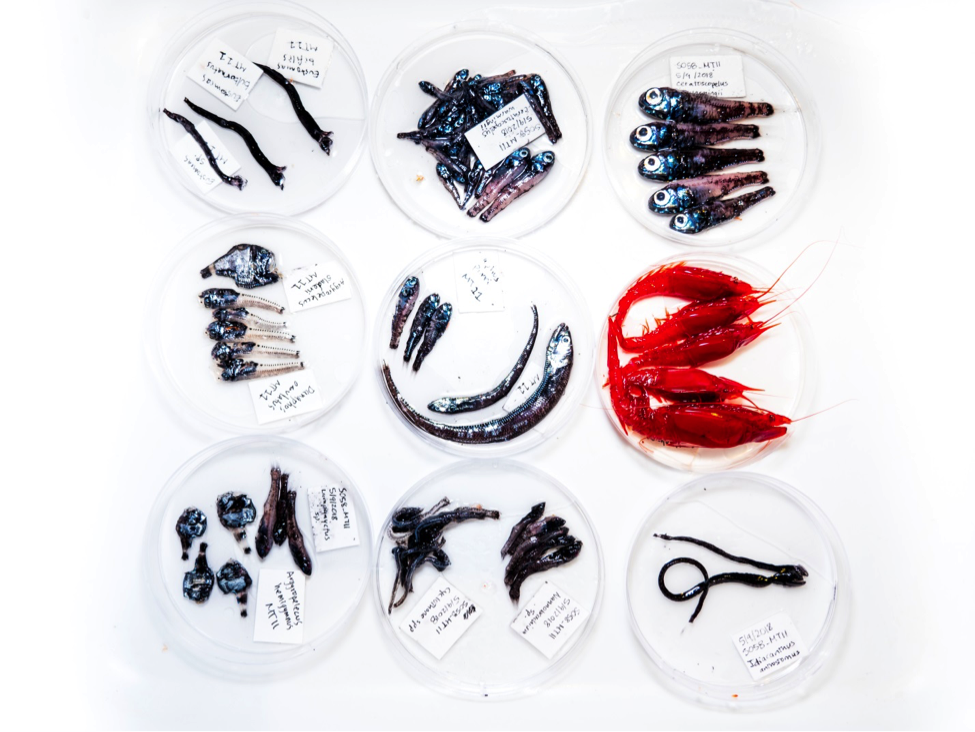
We conducted CTD casts (w/fluorometer and oxygen sensors) at 28 stations and collected water for Chl-a and nutrient measurements, and deployed a Slocum glider to collect fine-scale measurements independent of the ship. To quantify the midwater organisms within the scattering layers we gathered acoustic backscatter data from two Saildrones and the ship-based 5-frequency EK60 echosounder, and conducted 16 midwater trawls as well as nine midwater ROV dives. Both Saildrones also had ADCPs and current velocity was collected simultaneously to map mesoscale eddy features. We found a rich midwater environment in the area, with a deep Chl-max, a diverse assemblage of midwater organisms, and evidence of a food web that spanned phytoplankton and micronekton, squid, mesopelagic predators, tunas, and sharks. The conclusion was that the trophic structure was capable of supporting a population of white sharks. Tissue samples from over 1000 midwater animals were stored for stable isotope analysis to further ascertain food web dynamics in the region. Environmental DNA was collected, with shipboard sequencing detecting over 100 vertebrate species, including white shark and many of the fishes observed in the trawls. Finally, 9 satellite archival tags were recovered throughout the expedition, and another back in Monterey from a shark that had visited the café just before the expedition, doubling the days of tag data that have been collected in the café realm over the past 20 years. In post-cruise analysis, the team will synthesize the numerous oceanographic datasets to better understand how characteristics of the ecosystem relate to the fine-scale behavior of the sharks, in the ongoing investigation to solve the mystery of the White Shark Café.
More information about the expedition as well as preliminary data are available online.